
Trace32
Trace32 start
When installing, the program is set to be installed under the C:\T32 by default.
It’s a good idea to rename the folder according to the version during installation.
This is because, regardless of the version, the default installation path for all programs is C:\T32,
and when the program runs, it searches for files in the installation directory.
If you have more than one version installed and in use, you’d need to rename the folder to “T32” every time you run a different version.
Since I use both the 2017 and 2023 versions,
I renamed the folders during installation to T32_2017 and T32_2023,
depending on the version. The reason for using multiple versions will be explained later.
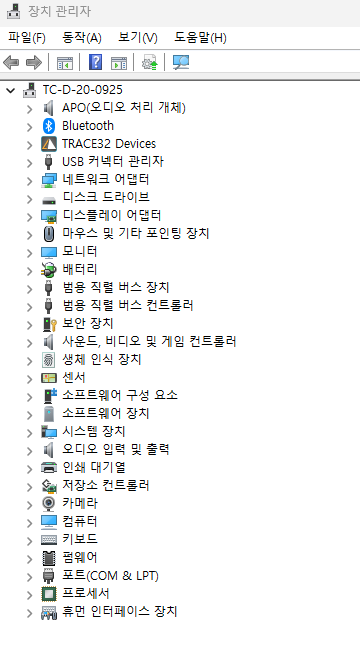
Connect the Trace32 debugger to the JTAG of the board and plug the USB into the PC.
You should confirm that the device is recognized by the PC.

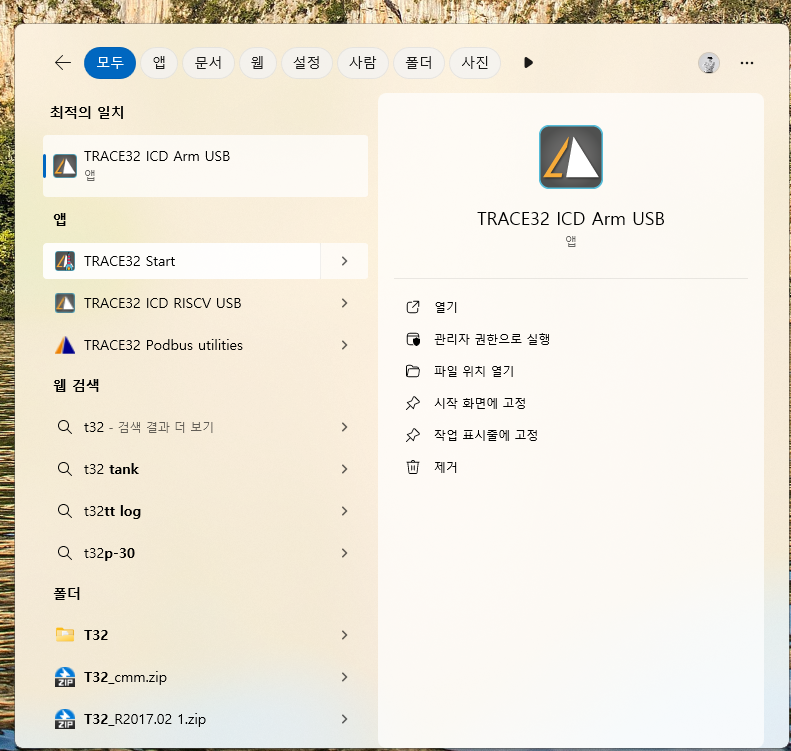
You can start the program by running C:\T32_2023\bin\t32m{arch}.exe , or you can launch it from the Start menu using “Trace32 Start.”
Since “Trace32 Start” also requires selecting the architecture, I usually prefer the former method.
Check License
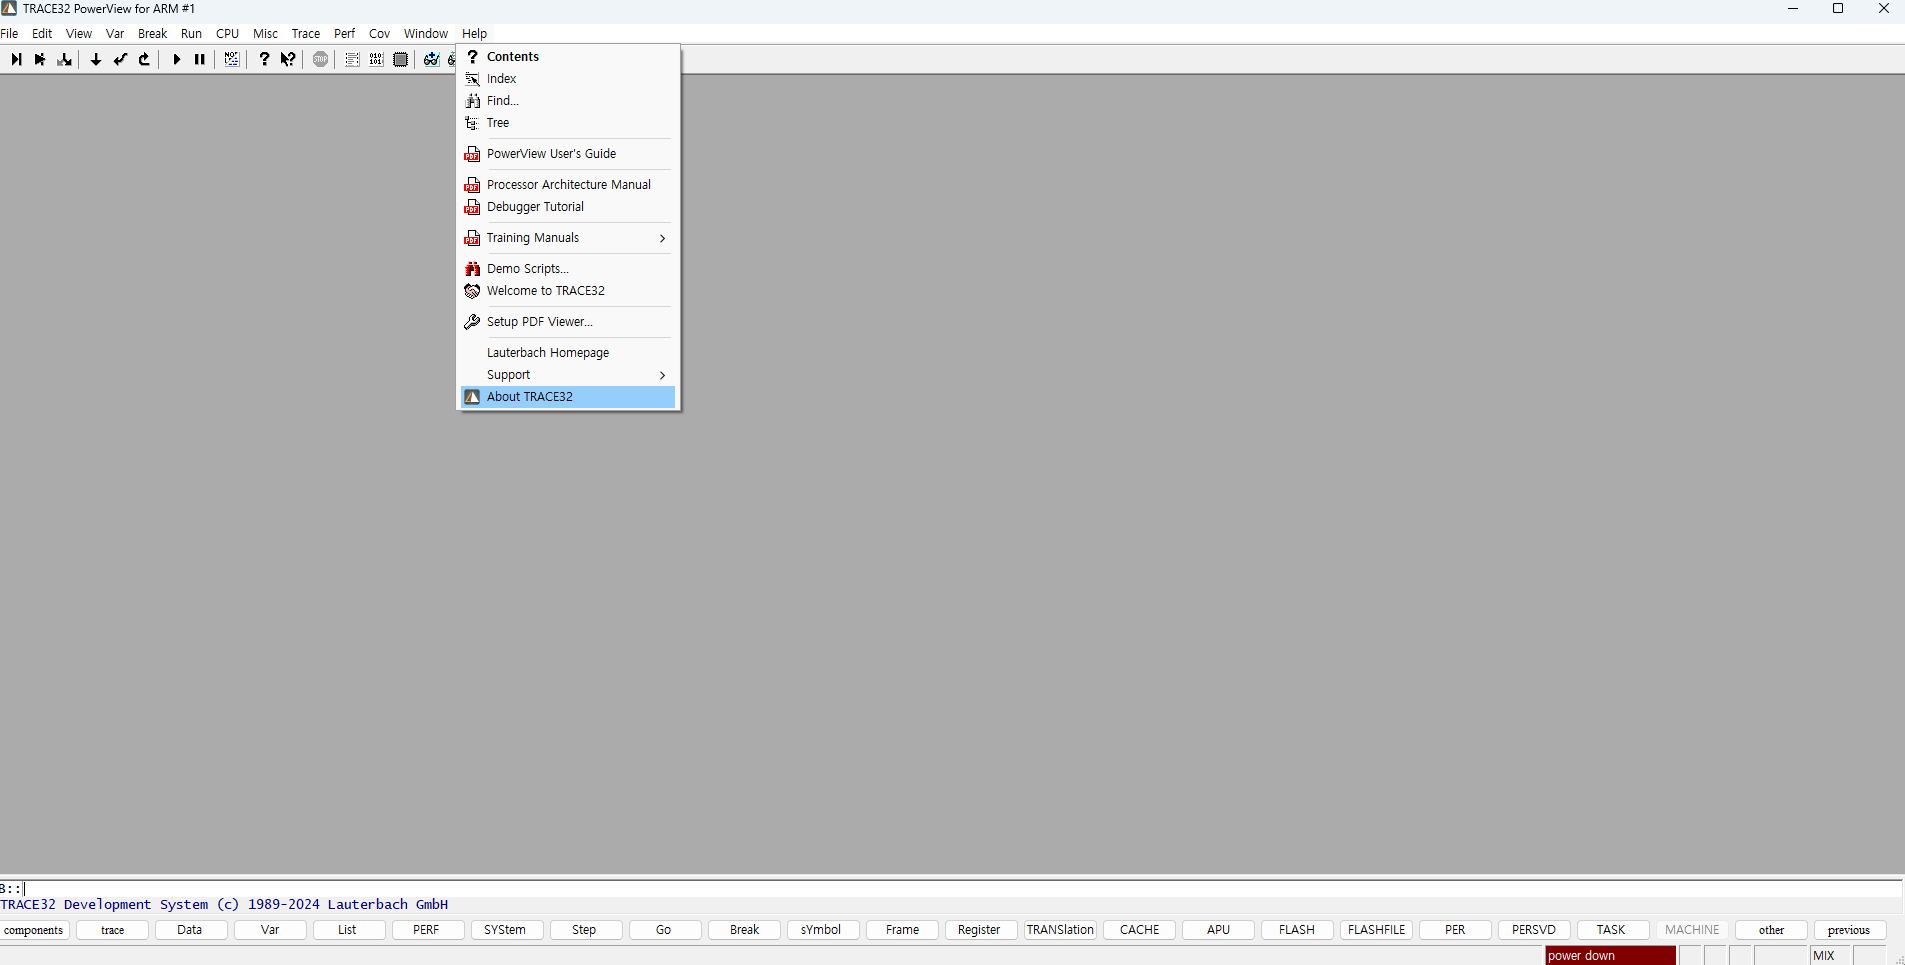
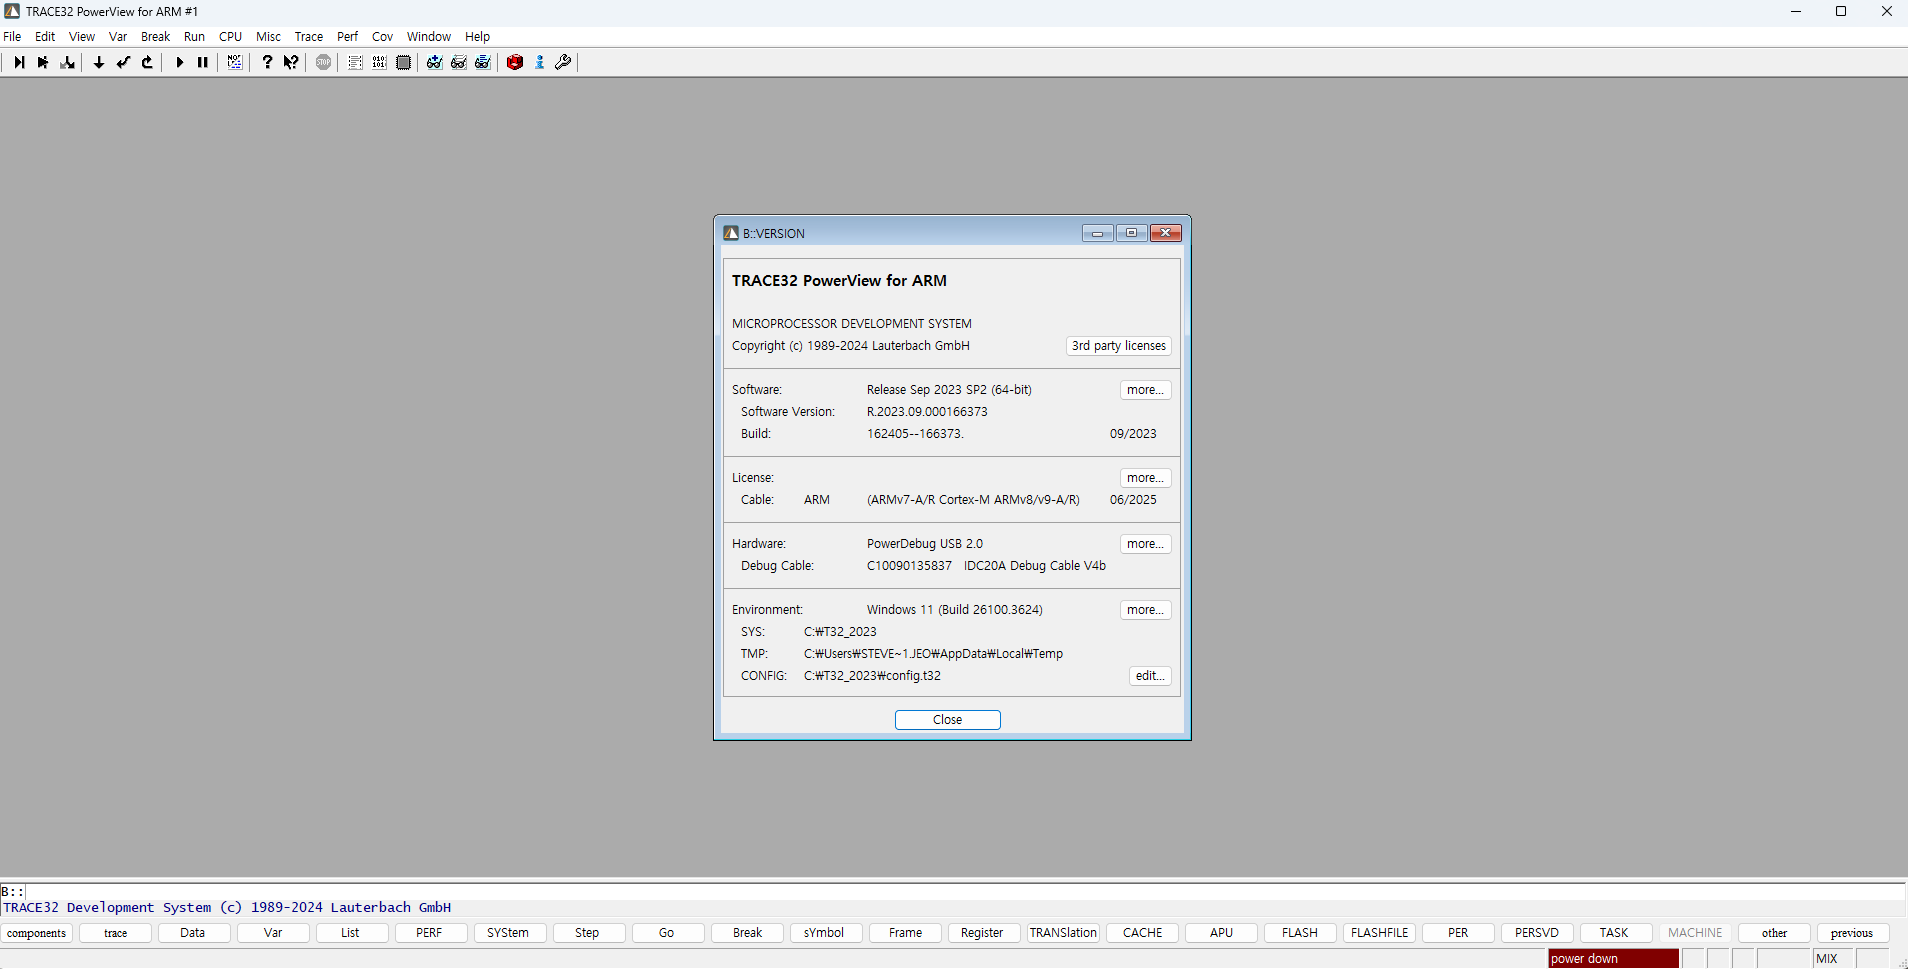
On the initial screen after launching, you can click [Help] -> [About] Trace32
to check the program version information and license details.
In this case, the Software version is 09/23, and the debugger License is valid until 06/2025.
If the Software version is newer than the guaranteed License period, it will be used as a trial version.
In such cases, the program will terminate after 10 minutes.
This is why I install and use more than one version of the program.
Help
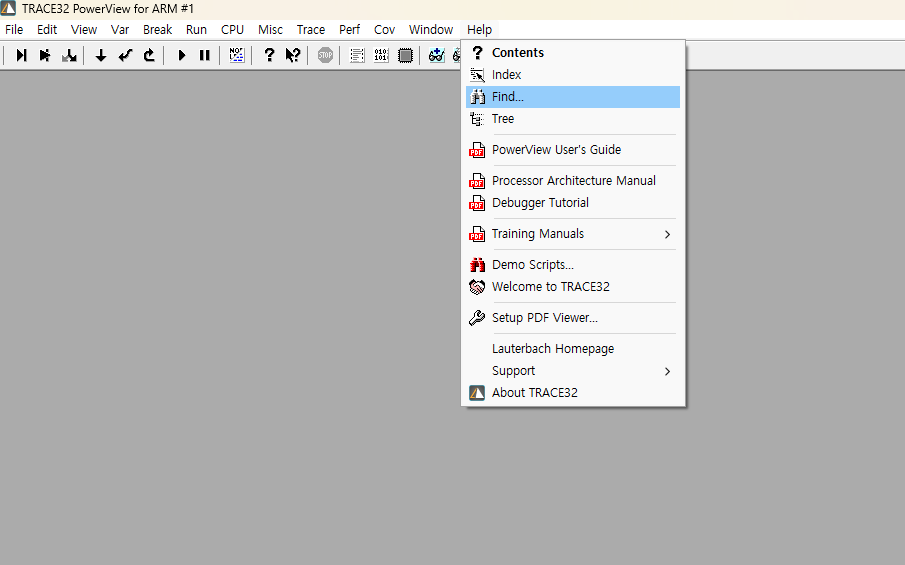
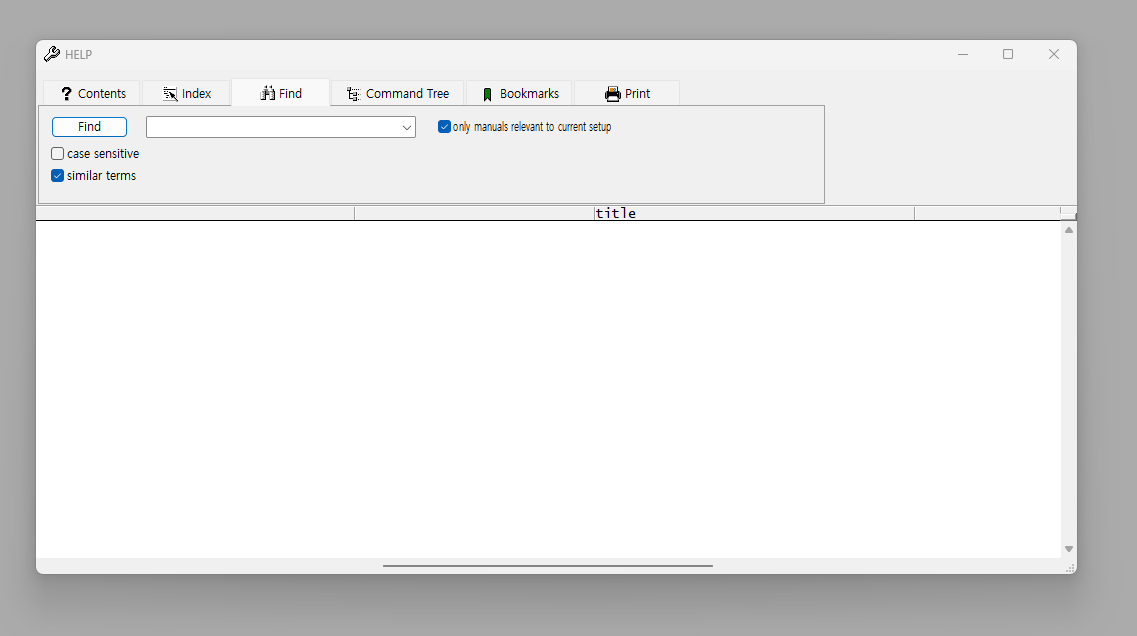
Trace32 is very well-documented, so most information can be searched for and found through [Help] -> [Find].
However, the sheer volume of information can make it a skill to locate exactly what I need.
Basic menu
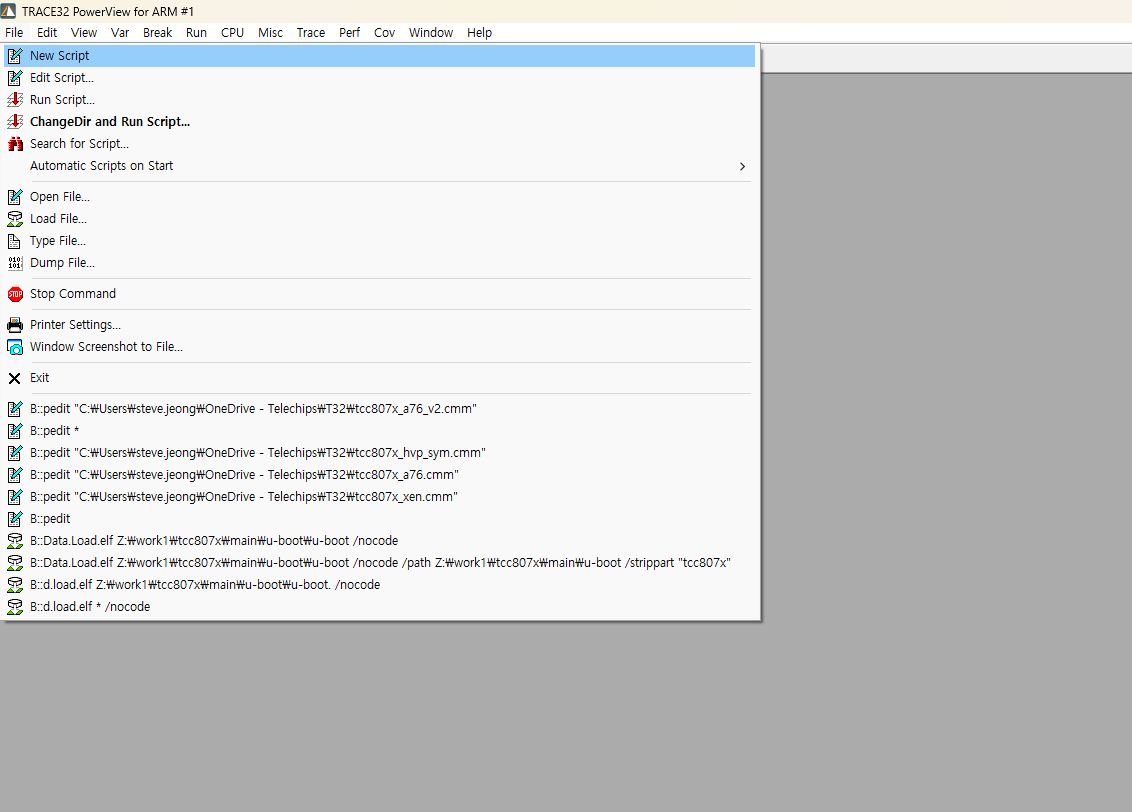
In the File menu, I mainly use the functions for creating or loading scripts.
The debugging program can also perform all operations based on commands.
You can create a new script by selecting “New Script” or use the B::pedit command to create a new script.
When selecting a menu through the GUI, you may notice options like B::pedit written in the menu window.
Ultimately, this executes by calling a command, and you can enter commands starting with B:: in the input window below.
If you right-click the frame of a new window,
the command will be auto-completed, and you can add further input as well.
Setup target
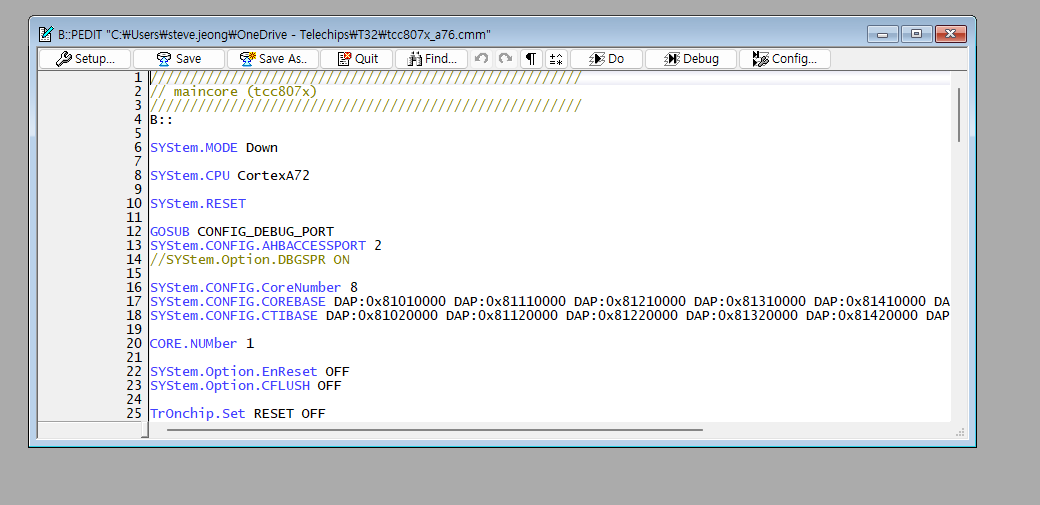
Now, use the attach script provided by the vendor to connect the board to the debugger program.
While you can configure detailed settings manually,
it’s impossible to do so without the Corebase and CTIbase information being provided.
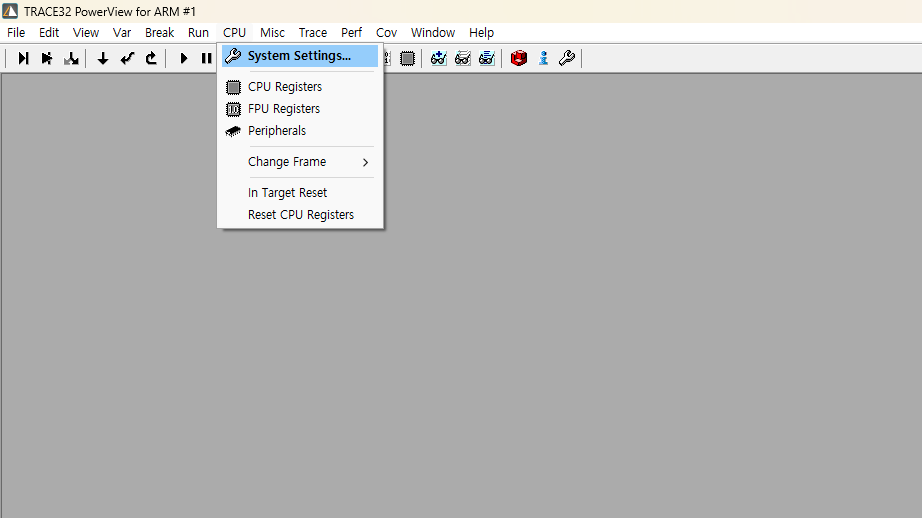
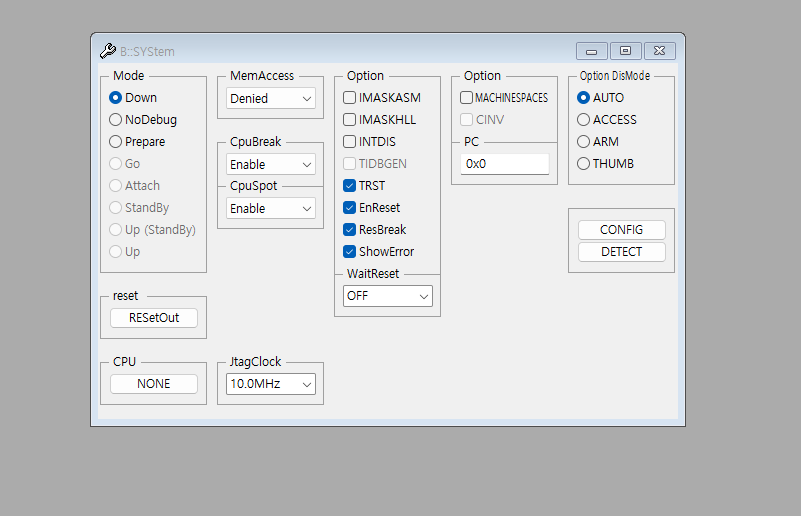
You can go to [CPU] -> [System Settings] to modify core information, or, as shown in the frame,
you can use the command B::SYStem to bring up that menu.
Commands are not case-sensitive, and the parts written in uppercase can be used as abbreviations.
For example:
SYStem == sys / sYmbol == y
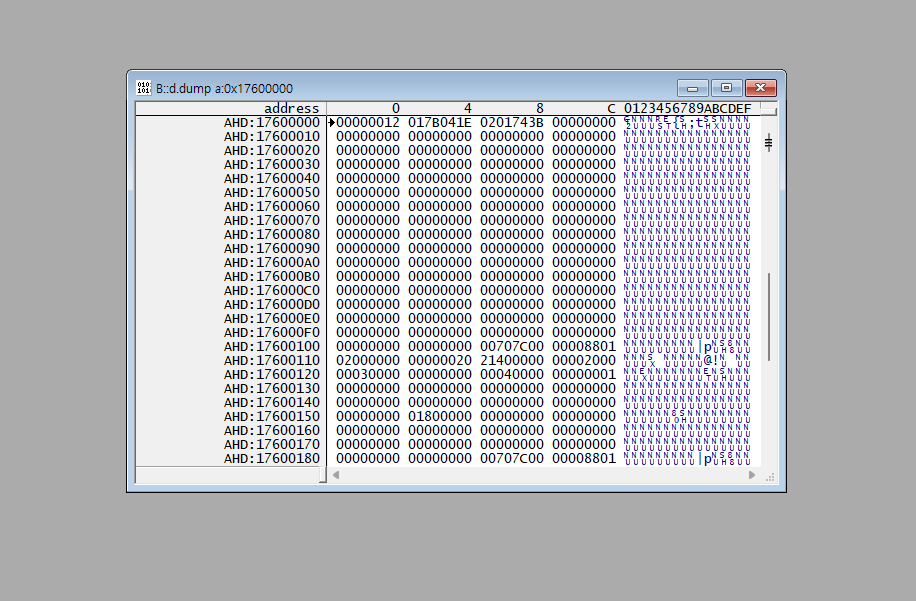
There are various system modes, and by connecting the debugger with “attach” and setting a breakpoint with B::break,
you can dump and view the memory area like this.
The principle is to break the CPU and view the memory through the CPU.
The “AHD” in front of the address indicates the class: A stands for physical address, H stands for EL2, and D stands for data type.
By prefixing the class with “a,” you can access registers mapped to the physical address memory.
So, how do you access architecture system registers?
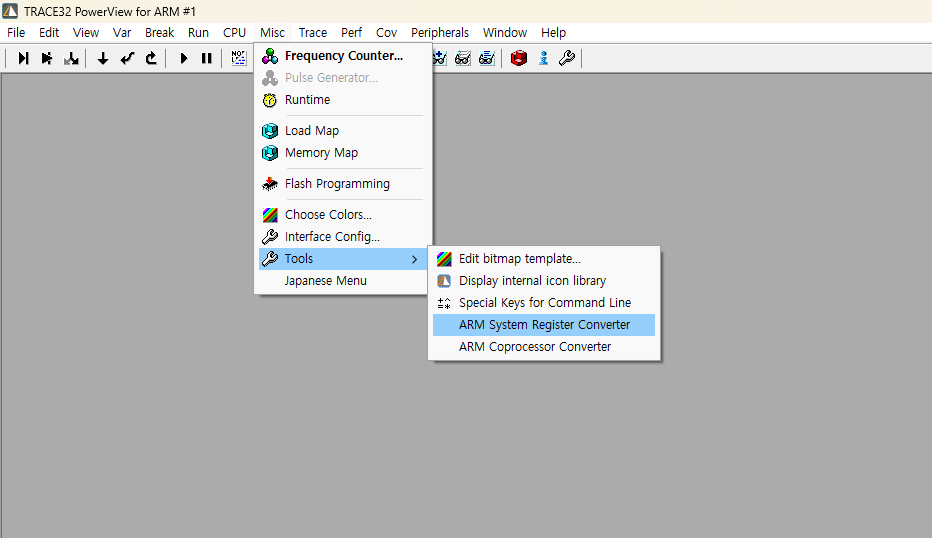
ARM-A provides a tool to access system registers encoded in this way. (As of the 2023 version)
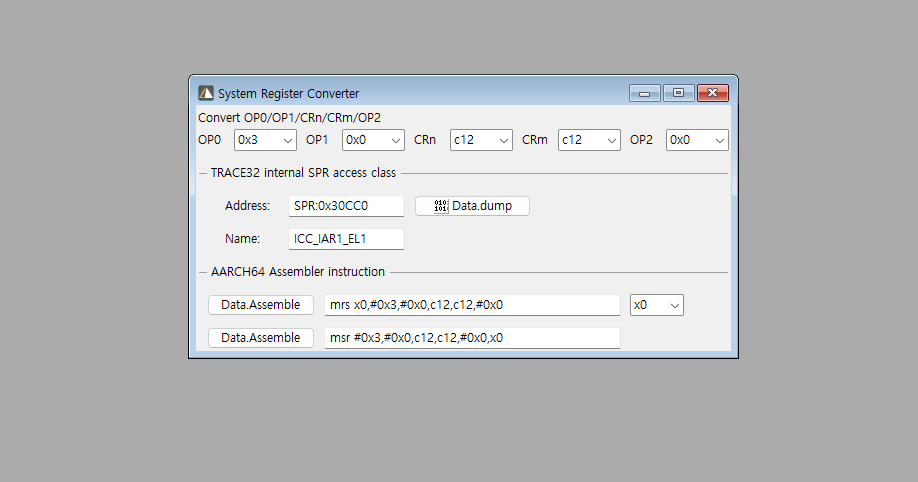
You just need to find and access the register address you need.
Alternatively, as shown in the tool, you can access it using the “spr” class
(e.g., B::d.dump spr:0x33e21).