
Trace32
Trace32 debug
Trace32 Debugging Environment in this posting
The host PC environment is a Windows 11 (x86 PC).
The target board environment is an ARM-A Linux kernel 6.12.
CPU Attach
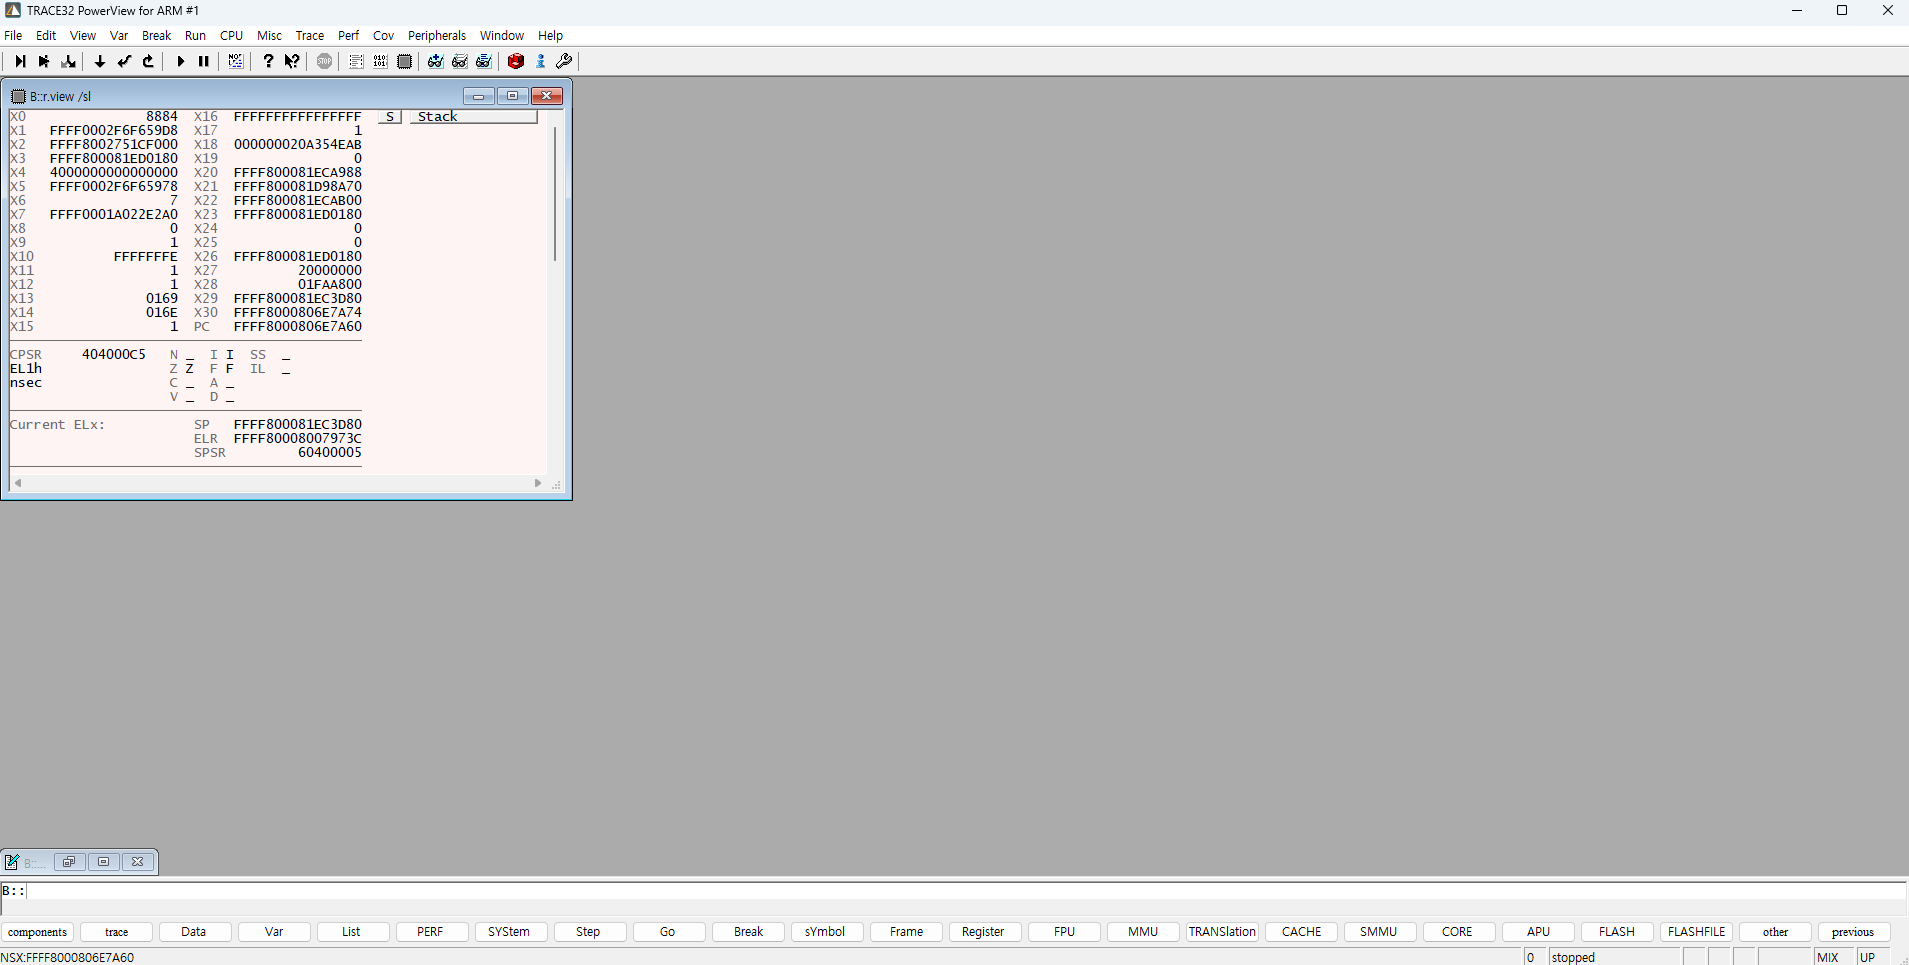
Start with the chip attached.
Since chip verification is mostly register-based,
there’s no need to load symbols and follow the code, but if debugging is required during kernel operation,
you need to load symbols and track the code.
Program Counter
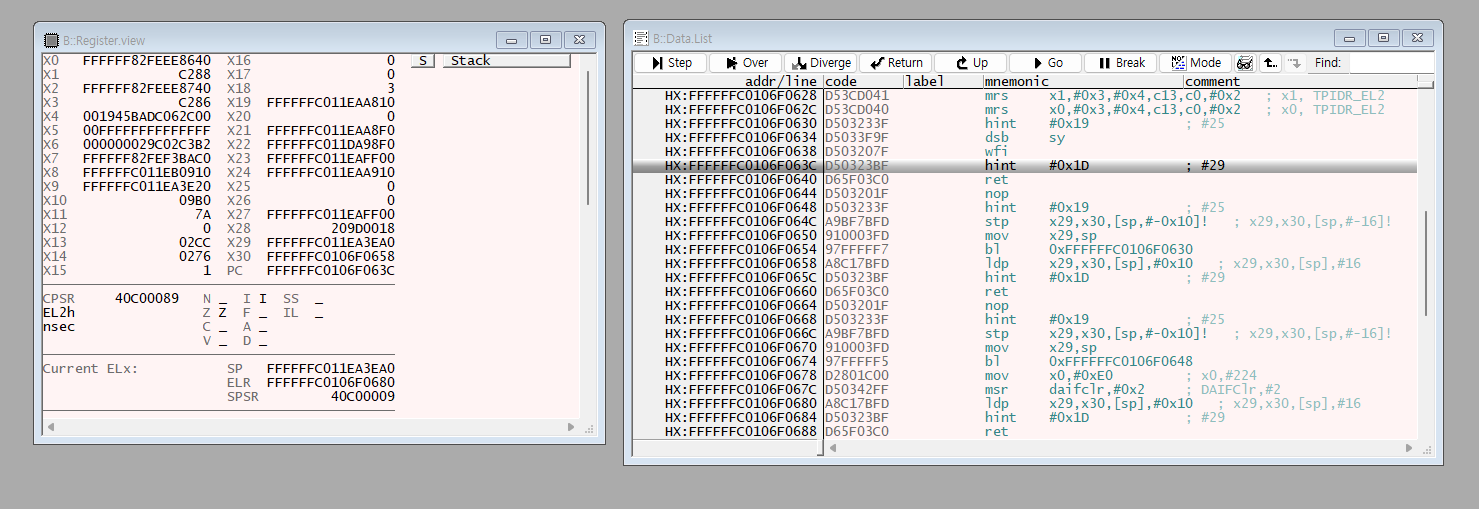
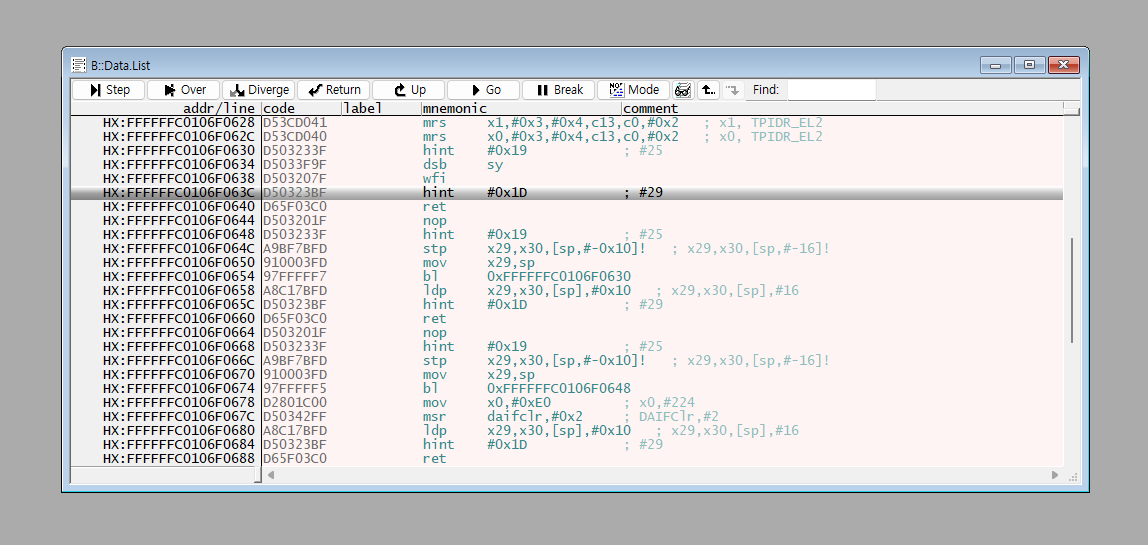
Using the B::Data.List command allows you to check the address currently pointed to by the PC.
The B::Data.List toolbar includes Step,Over, Diverge, Return, Up, Go,Break, and Mode operations.
Let’s narrow it down to a few commonly used ones:
Step executes the code while incrementing the PC by 4 each time.
Over executes the code by skipping over function units.
Up completes the execution of the currently entered function and reduces the stack depth by one level.
Mode lets you choose whether to break it down into assembly code units.
When broken down into assembly code units, it displays the code in a form modified by the compiler’s optimizations.
This can be utilized after loading symbols.
Upload Symbol
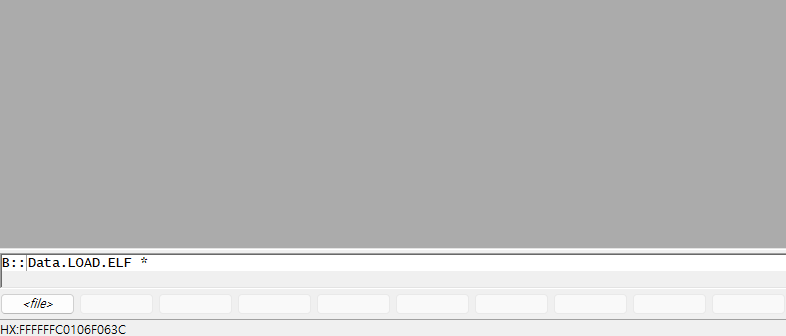
Symbol registration is done by executing the B::Data.LOAD.ELF {elf file} command.
The command supports auto-completion with the ‘Tab’ key, making it convenient to use.
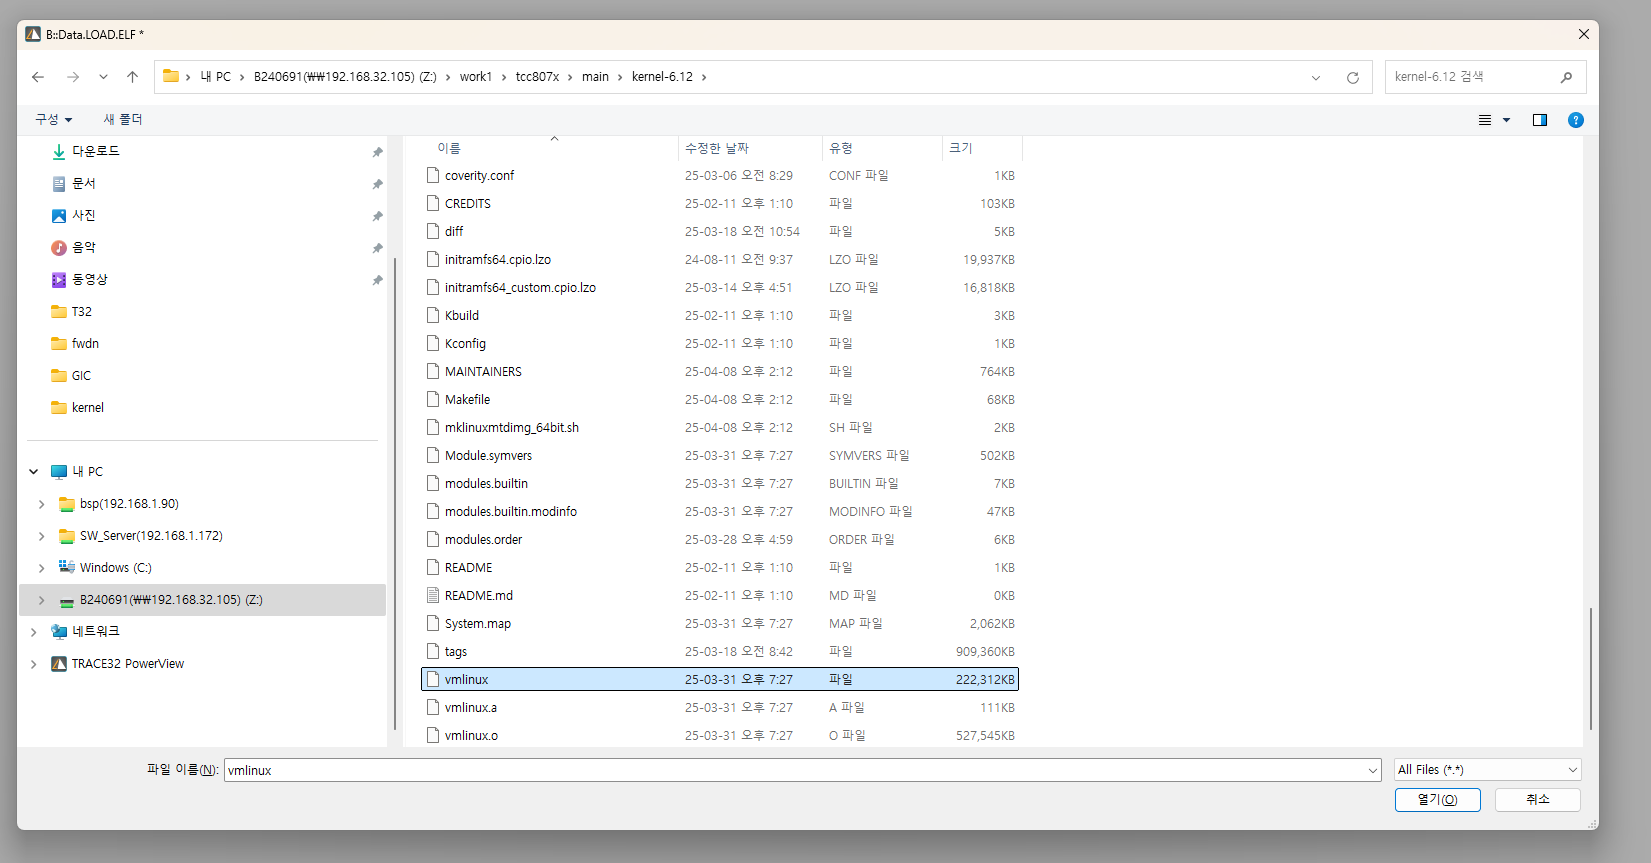
You can manually enter the file path, but using * opens the file explorer, allowing you to select it directly.
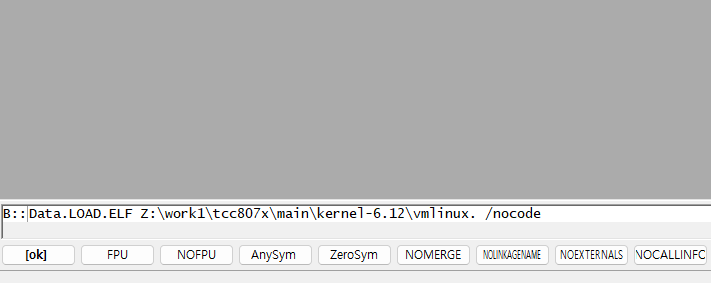
If you simply select the file, an error will likely occur.
Since this is done without uploading the code, use the /nocode option.
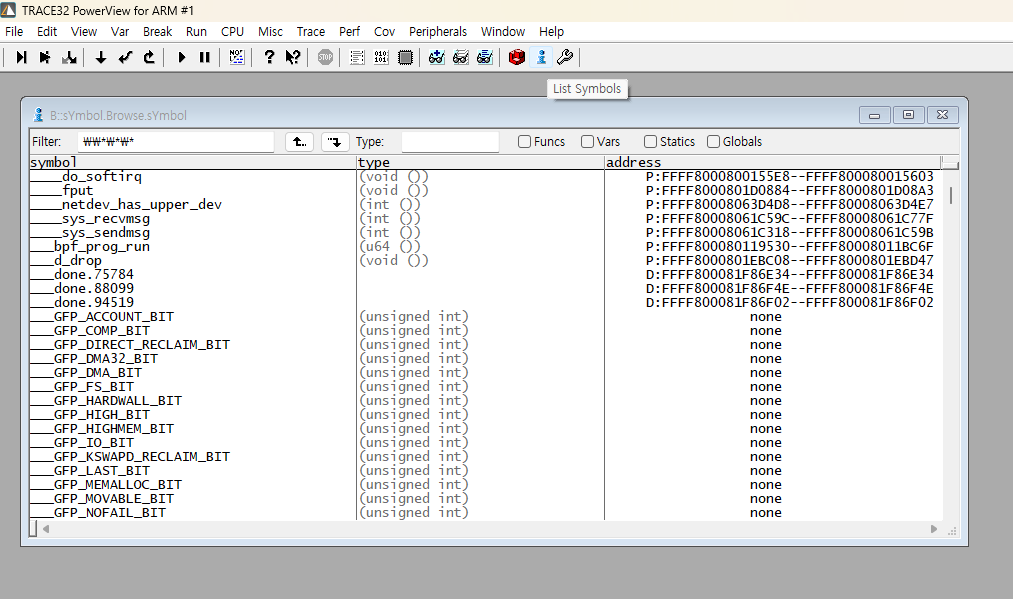
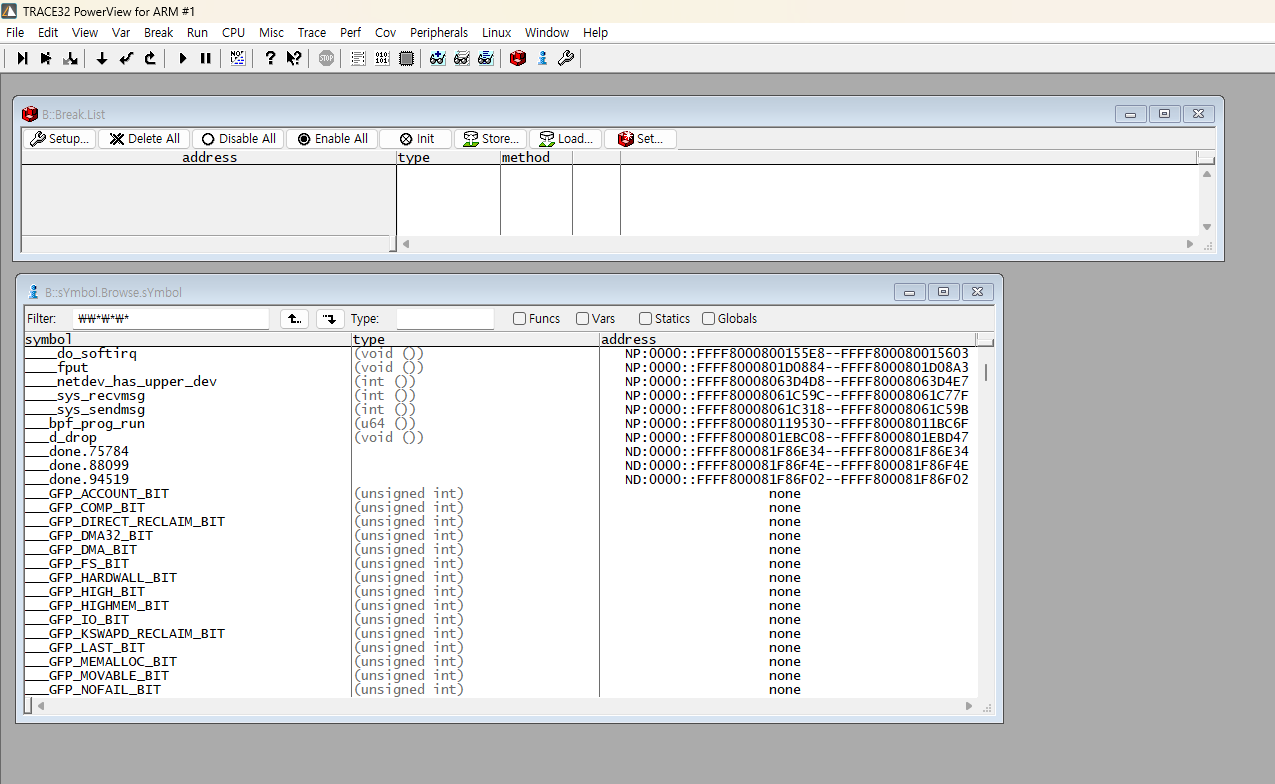
Once the symbols are successfully loaded, you can view the symbol list like this.
You can see the symbol list by clicking the blue exclamation mark on the GUI,
or by using B::sYmbol.Browse.sYmbol or B::y.list .
If the symbol you’re looking for isn’t visible, you need to expose the symbols during the kernel build.
(Usually, removing “static” is enough to expose the symbols.)
Now, with the B::Data.List command, you can check the code currently pointed to by the PC.
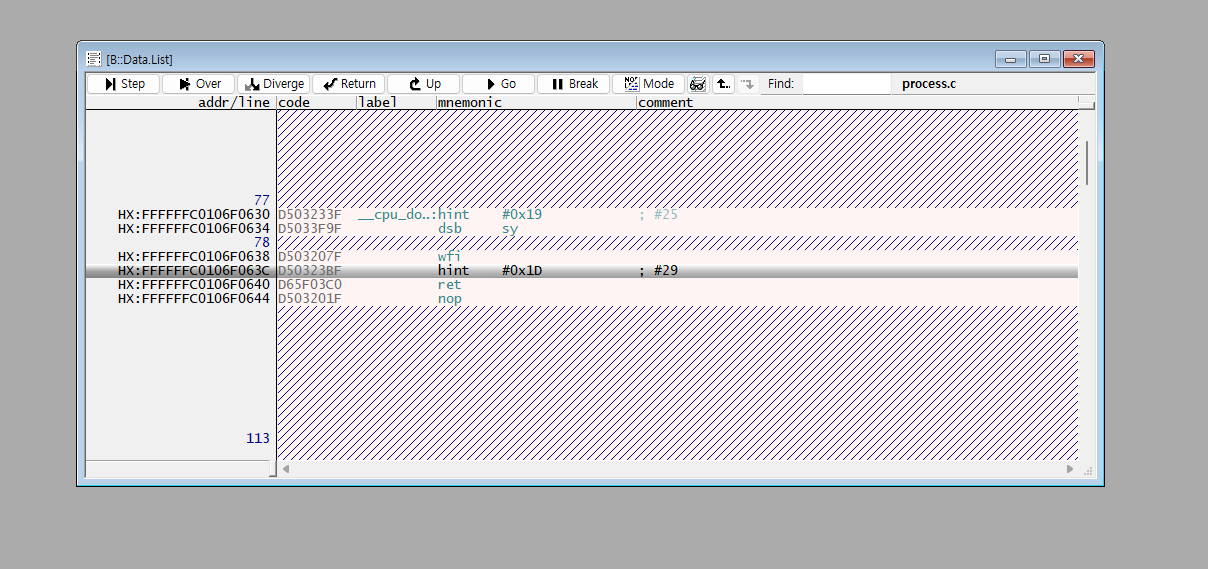
However, if the code doesn’t display properly and is covered with diagonal lines,
it’s because the symbols aren’t correctly matched. This issue occurs when the symbol path cannot be traced,
and you need to realign the symbol path.
This varies depending on each debugging environment;
(in my case, I’m connected from a Windows PC to a remote VM via a Samba server.)
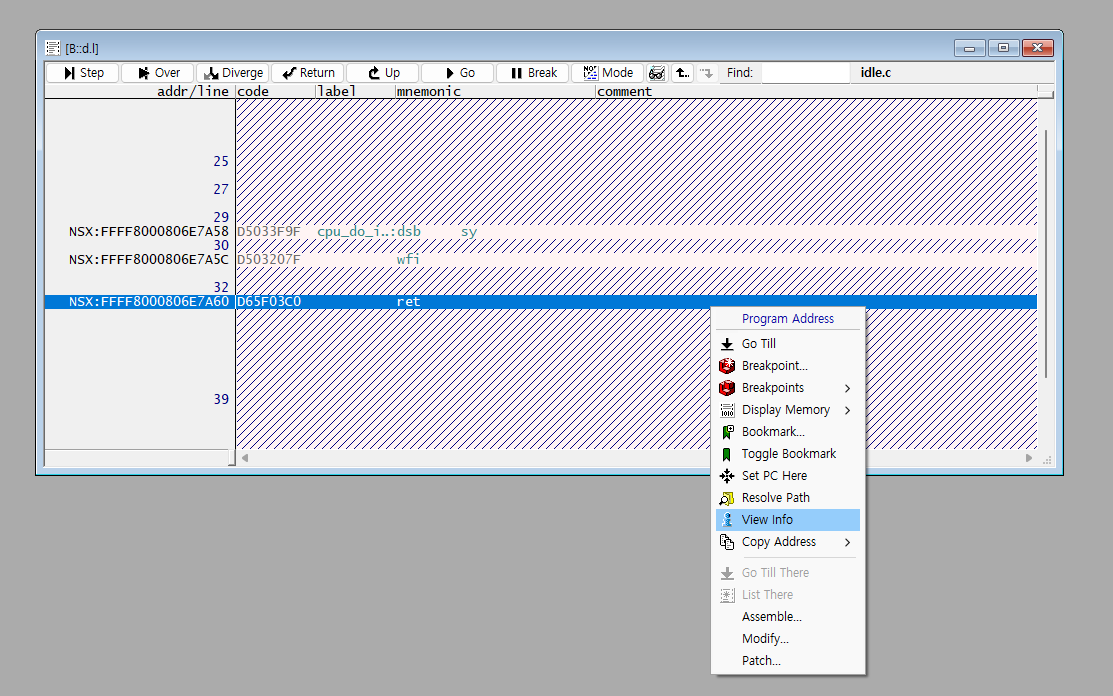
First, right-click anywhere in the window and then select “View Info.”
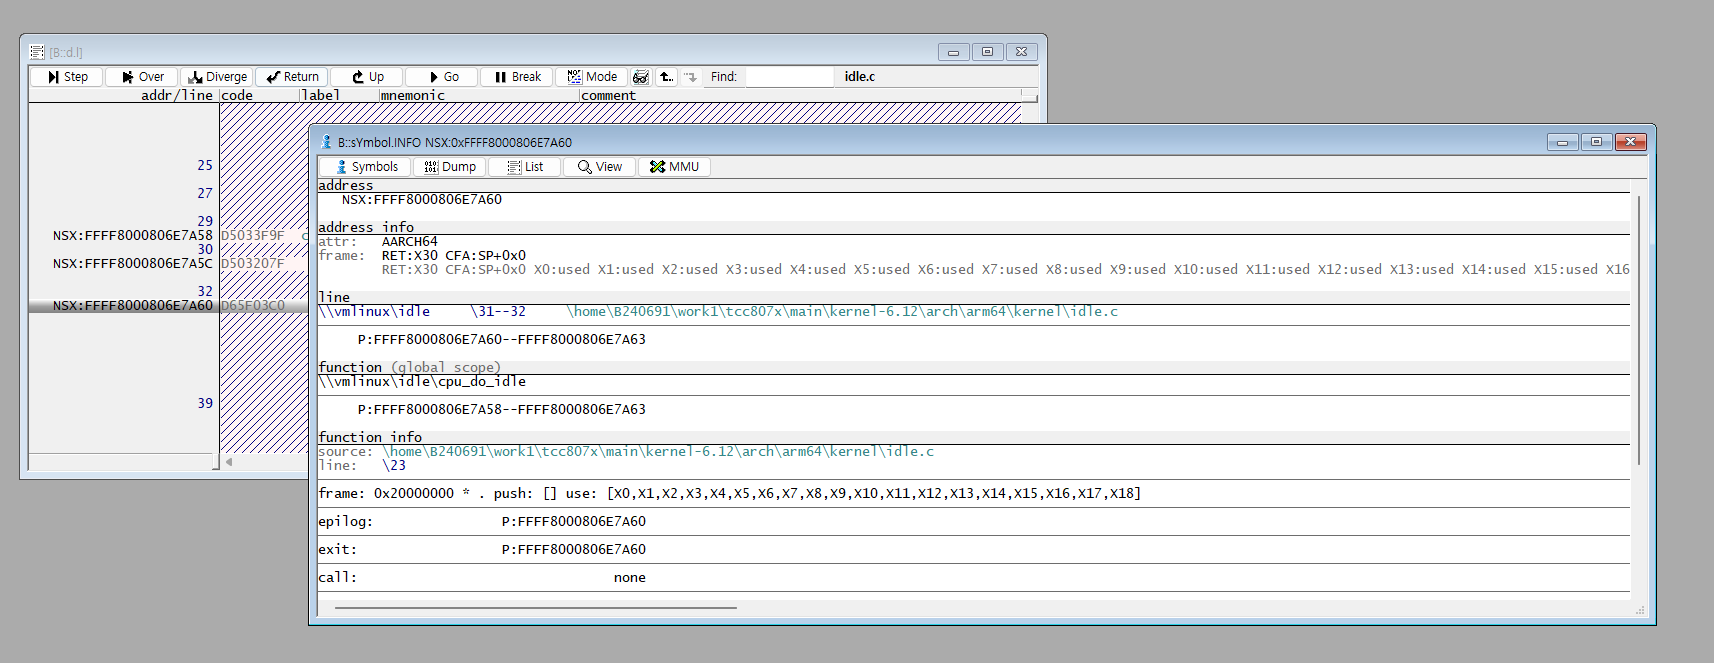
This displays the path where the symbol (ELF file) was stored when it was built.
Check whether this path is traceable from the current host OS.
In the current environment, since the host OS (Windows) cannot trace idle.c
located on a VM connected via a Samba server, you need to make the path traceable.
Resolve Path
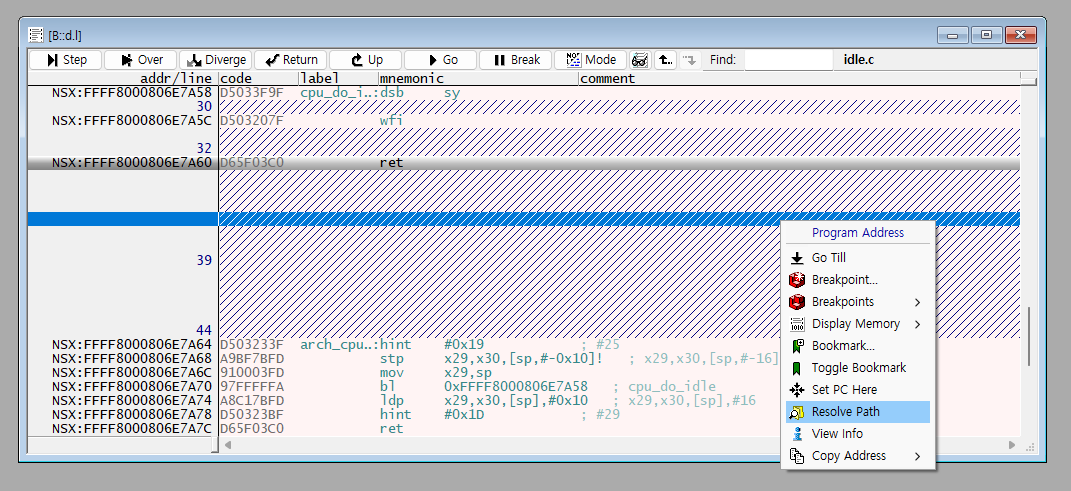
Right-click and select “Resolve Path.”
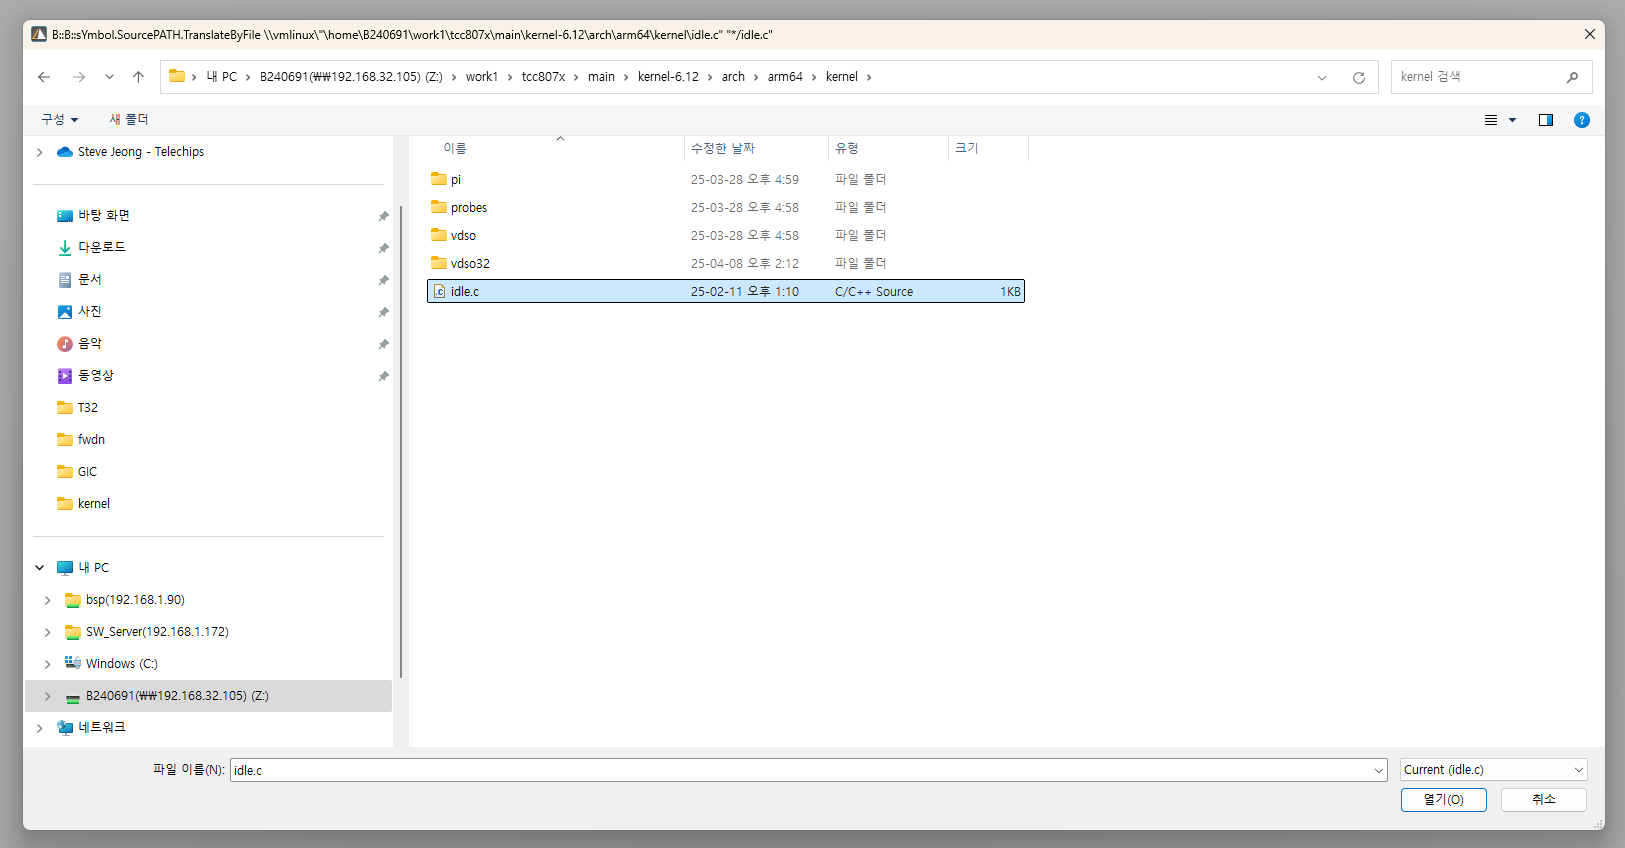
You can resolve it by finding and selecting the source that the symbol actually points to.
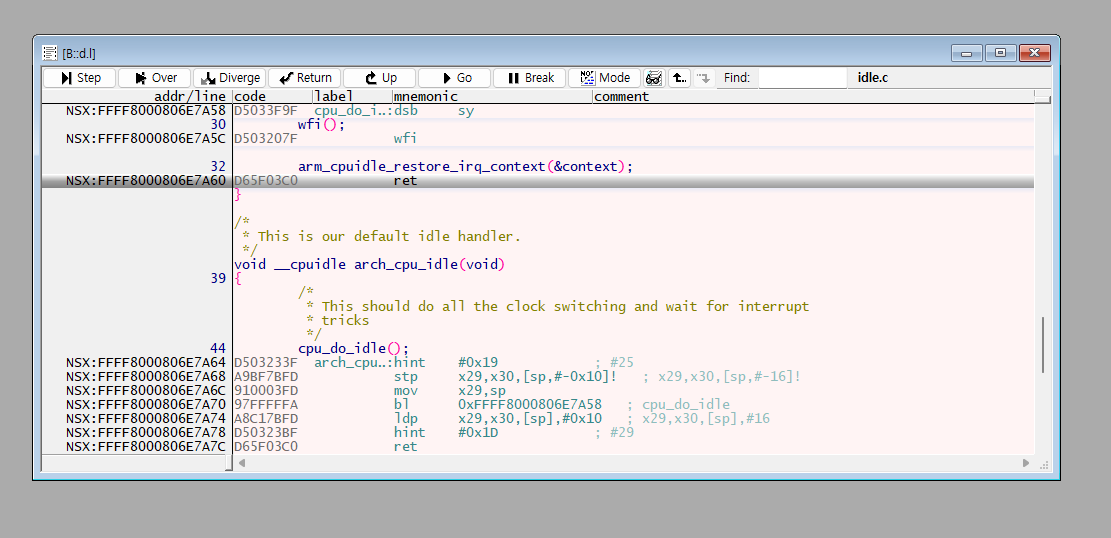
You can confirm that the previously invisible code is now fully visible.
Practice command 1
Perform B::sYmbol.RESet and repeat the process up to the point right after loading the symbols again.
Use the B::sYmbol.SourcePATH.Translate {invalid path} {correct path} command to change the untraceable path to a traceable one.
The “\home\B240691” part cannot be traced by the host OS.
If you modify this part to the “Z:” path connected via the Samba server, it becomes traceable.
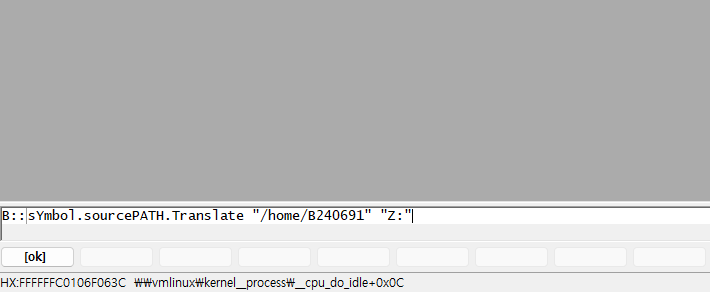
With the command B::sYmbol.SourcePATH.Translate “/home/B240691” “Z:” ,
the symbol matching has been successfully completed.
Practice command 2
There’s also a method to align the path from the start when loading the symbols.
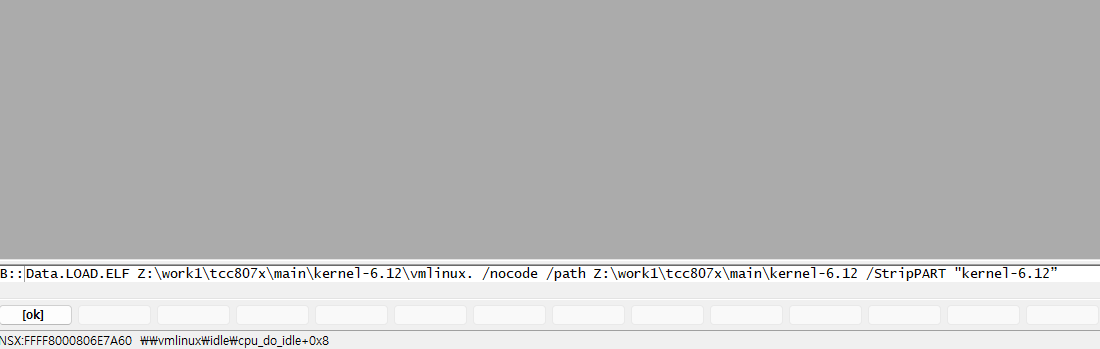
With the command
B::d.load.elf Z:\work1\tcc807x\main\kernel-6.12\vmlinux /nocode /path Z:\work1\tcc807x\main\kernel-6.12 /StripPART "kernel-6.12"
you can load the symbols while aligning the path from the start.
The moment vmlinux is loaded,
the symbol path stored in the symbol file is registered in the debugging program,
and this is overridden with the /path option.
Then, the “kernel-6.12” portion of this path is trimmed using the /StripPART option.
Break Point
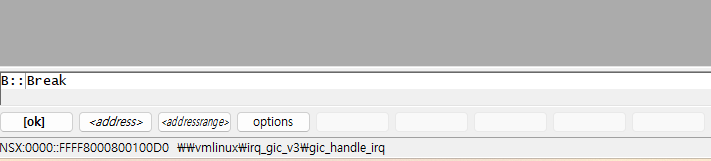
Use B::Break to halt the CPU.
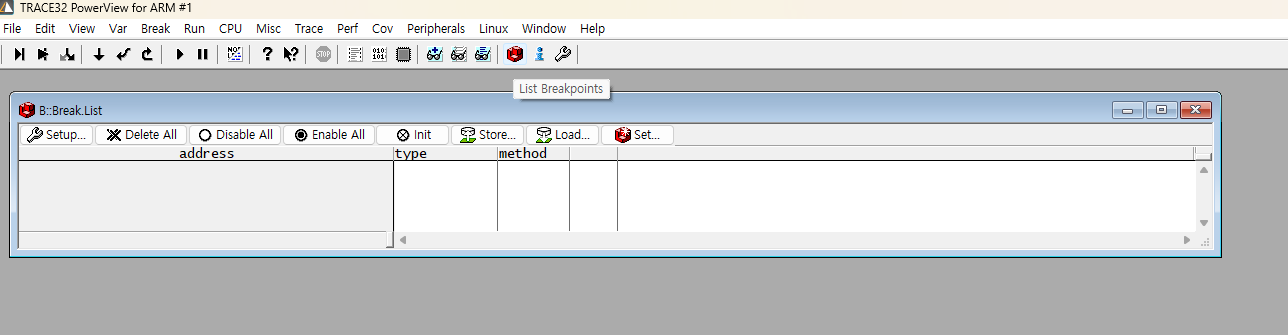
Select the Break Point option from the top menu, or execute the B::Break.List command.
Open the symbol window and search for the symbol you want to set.
If a function is not exposed as a symbol, it cannot be found. In that case,
you need to expose the symbol, rebuild the code, and upload it again.
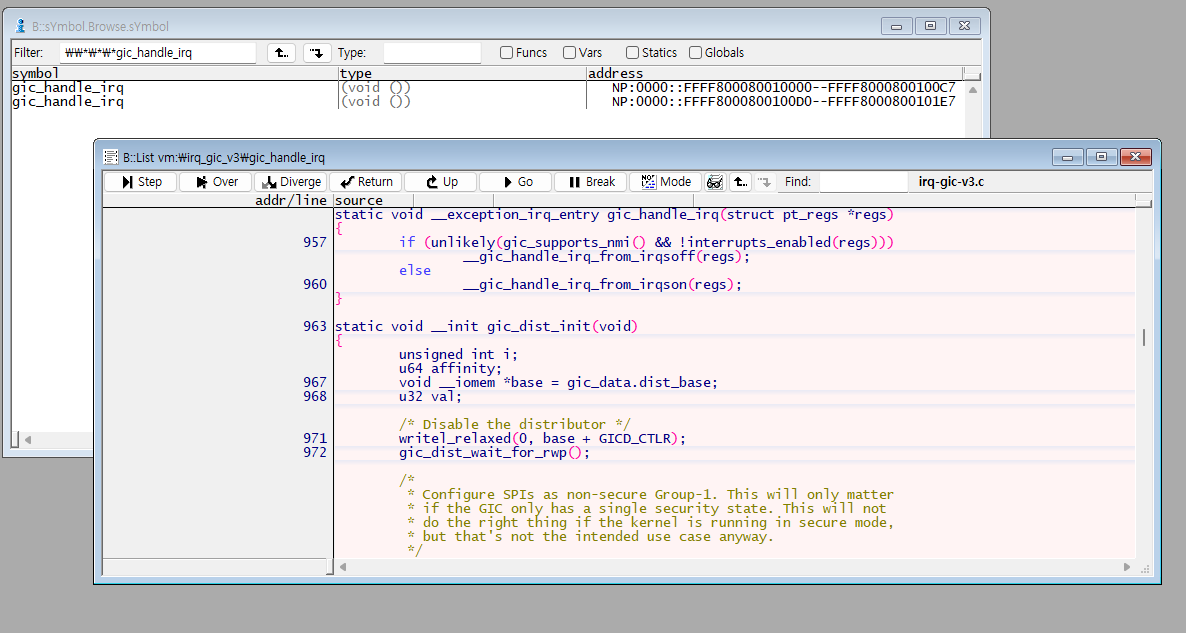
For example, if you want to set a breakpoint inside the GIC handler at gic_handle_irq ,
search for the gic_handle_irq symbol.
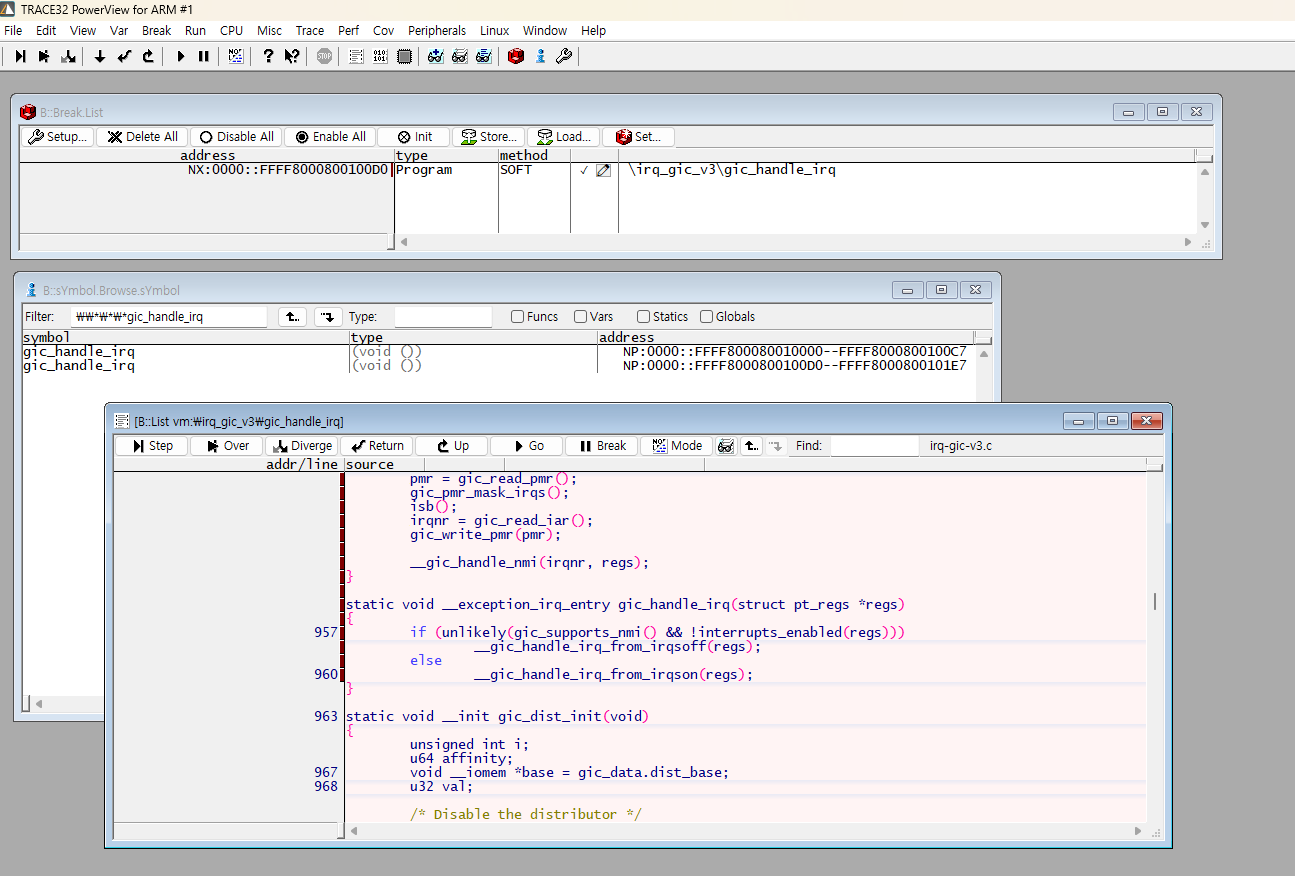
Once found, you can double-click the symbol to set a breakpoint.
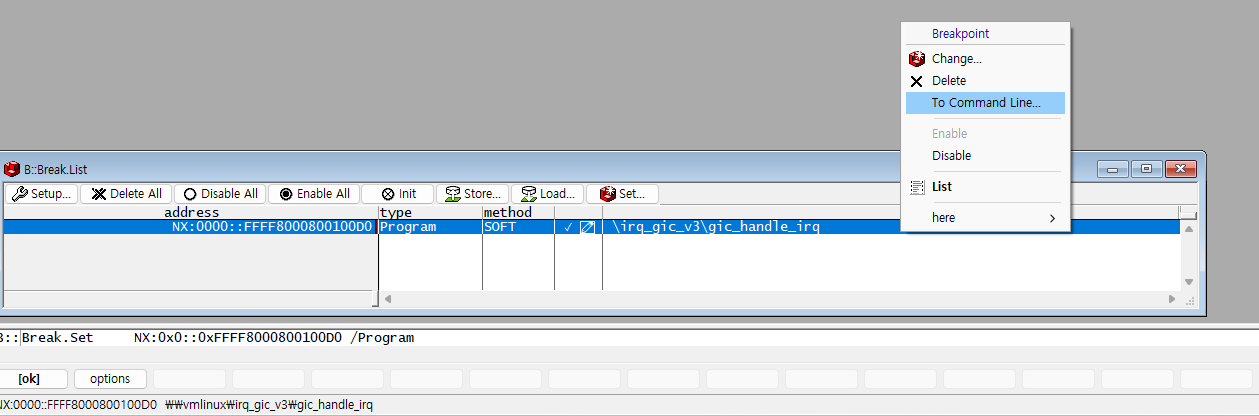
Select “To Command Line…” to switch to command mode.
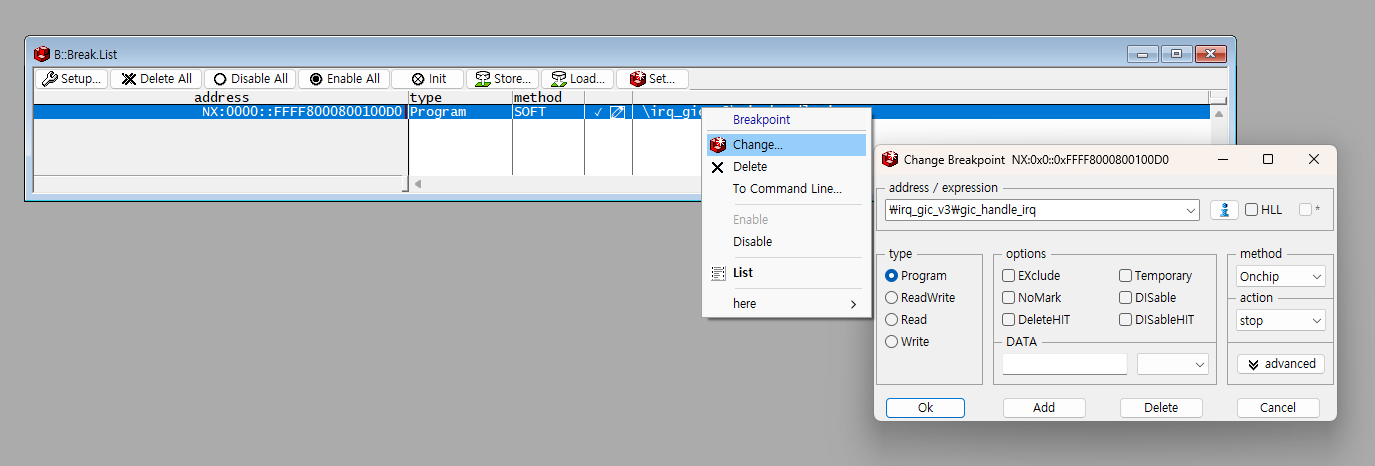
It is recommended to change the breakpoint method to /Onchip before use.
The default is /SOFT, which relies on a software fallback mechanism,
So breakpoint information may be lost.
If you use the /Onchip option,
the Virtual Address is stored in the ARMv8-A breakpoint registers( DBGBVRn_EL1 and DBGBCRn_EL1 ).
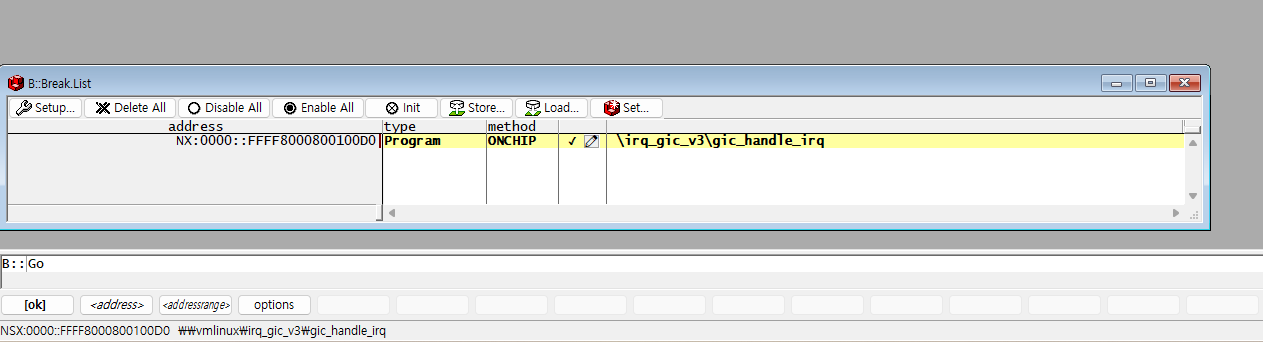
Due to the interrupt-driven nature of the Linux kernel,
a breakpoint will be hit almost immediately after executing B::Go
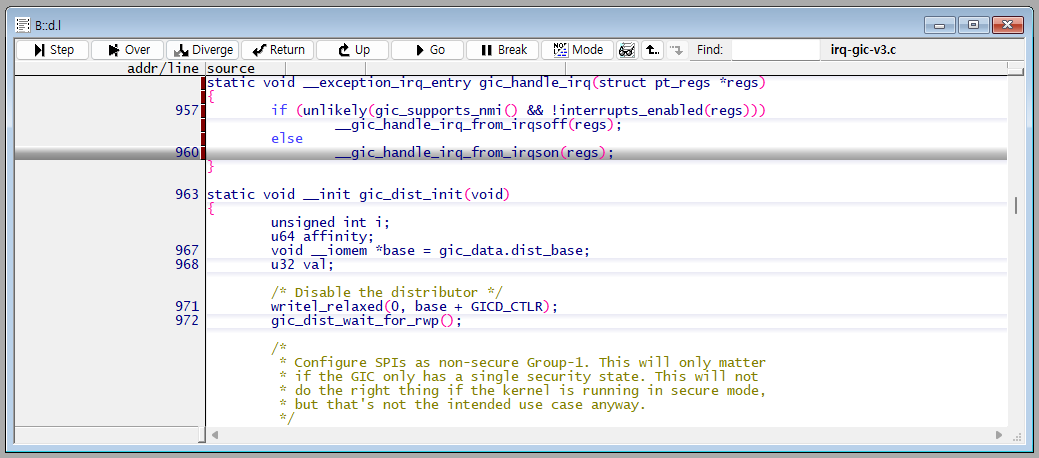
The PC (Program Counter) stopped at the gic_handle_irq section.
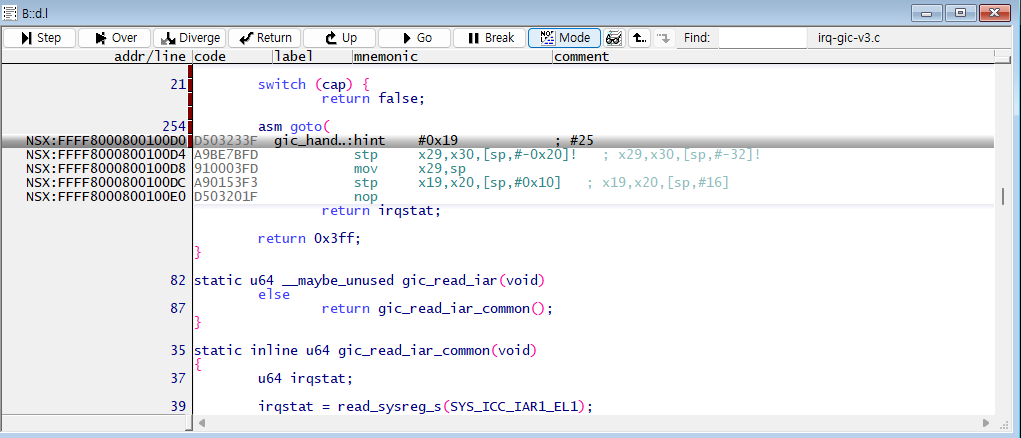
By selecting Mode, you can also analyze atomic operations.
(Note: Since the code is optimized into assembly, the actual layout may differ from the source code.)
When debugging by stepping through the code,
Step executes one command at a time depending on the selected Mode.
Over executes code line by line.
Go and Break are used to release or hold the CPU.
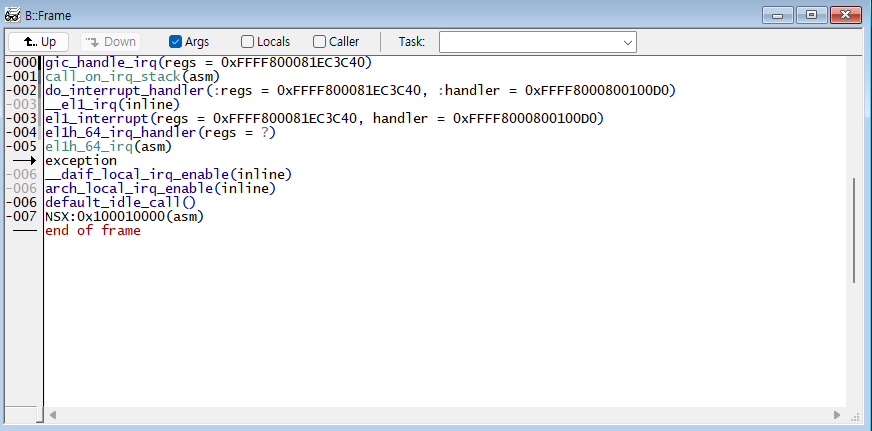
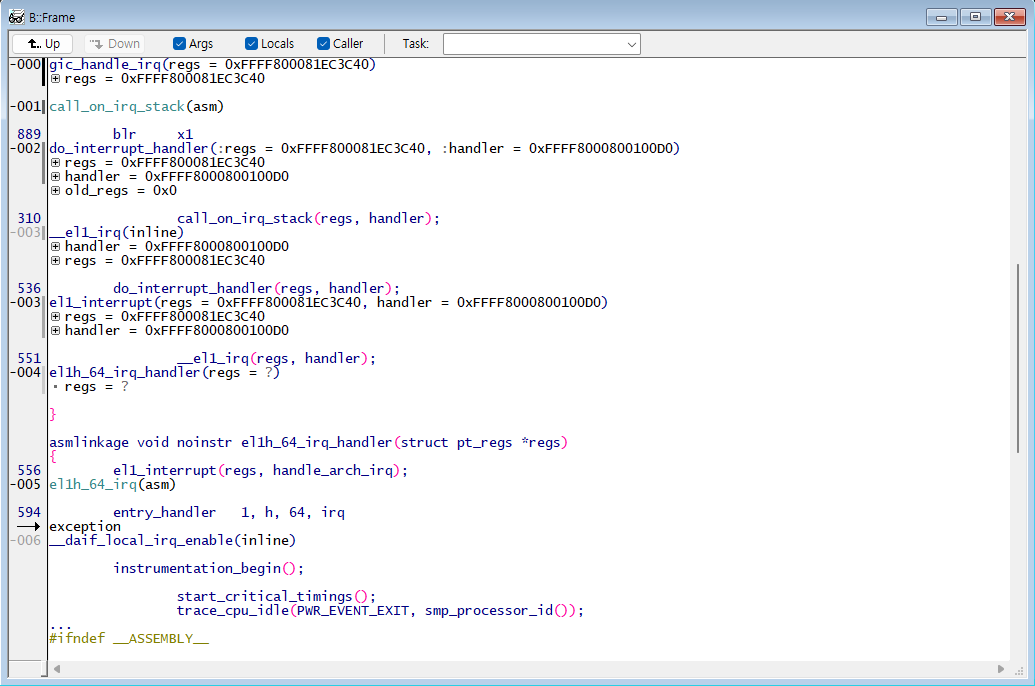
You can check the code stack using B::Frame You can navigate through the stack using Up and Down.
Locals and Caller can be viewed by adding options to the command or by selecting them directly.
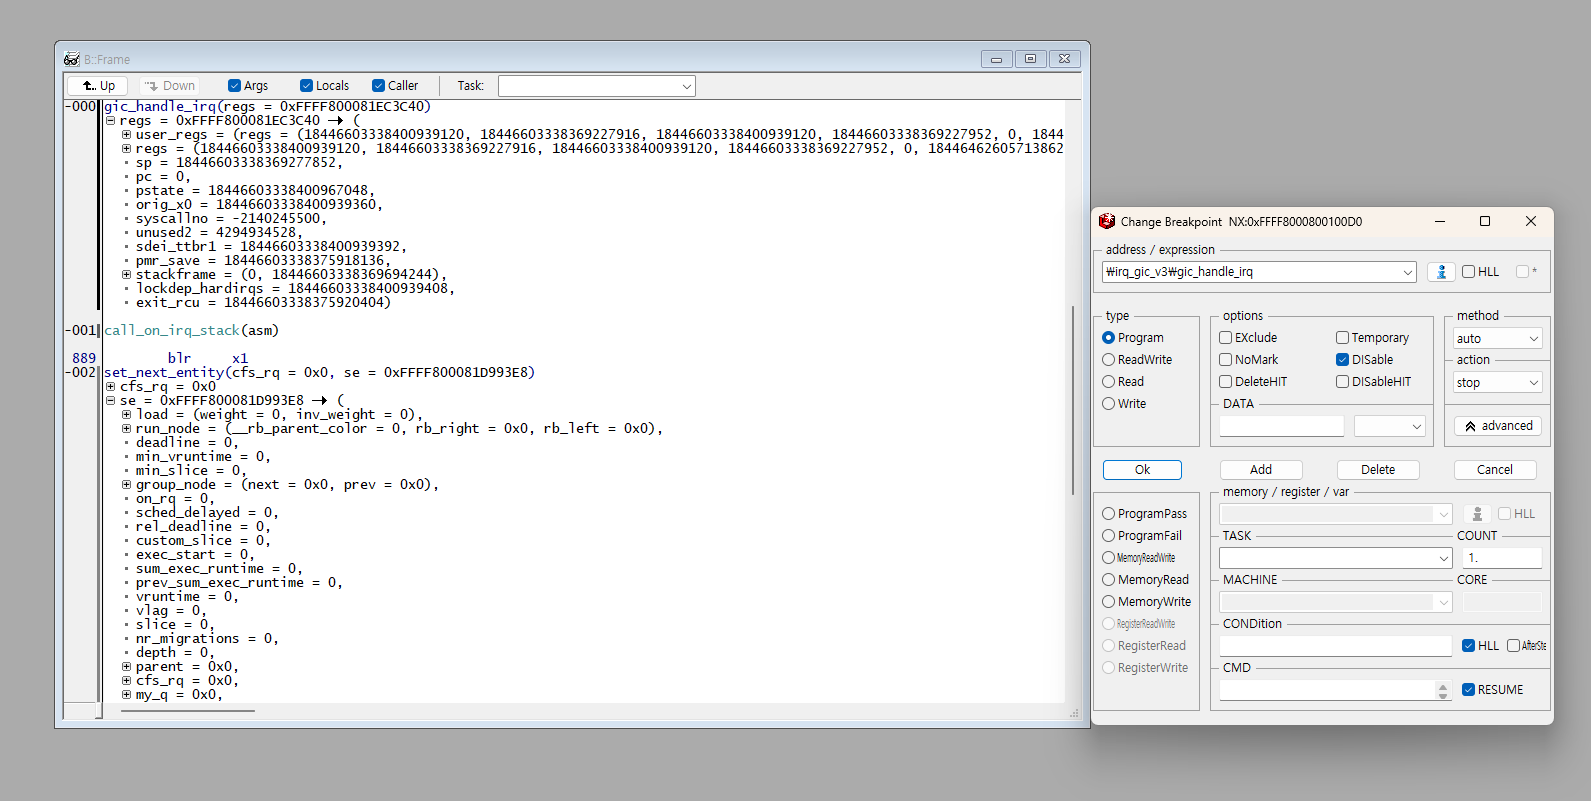
Additionally, breakpoints can be set with conditions.